Audiovisual Software Art
2 Sound Visualization and Notation
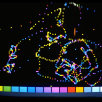
Forty-three years after John Whitney’s early experiments, real-time audiovisual software now comes as a standard component in every major computer operating system. At the time of this writing, a person’s first encounter with audiovisual software is most likely to be with a screensaver (a software utility that prevents burn-in on some kinds of computer displays) or with a music visualization plug-in for a computer-based media player. In many cases, these functions are combined into a single piece of software. The aesthetics of such systems are more than occasionally targeted to a broad casual audience with an interest in psychedelic visual culture. The influential screensaver and visualizer Cthugha, for example, created by the Australian software developer Kevin “Zaph” Burfitt between 1993 and 1997, was advertized as an oscilloscope on acid and as a form of visual entertainment, useful for parties, concerts, raves, and other events as well as just vegging out to mesmerizing, hypnotizing displays.[6] Despite this colorful language, Cthugha’s self-description as an oscilloscope is actually quite accurate from a technical standpoint. An oscilloscope is a tool for viewing the waveform (or time-domain representation) of a signal, such as music, in real time—and Cthugha is essentially an elaborated oscilloscope which decorates a sound’s waveform by rendering it into richly colored variations of video feedback. Sound waveforms are the simplest possible information that can be extracted from digital audio data, and have therefore been used as the basis for numerous other visualizers as well, such as Geiss (1998–2008) and MilkDrop (2001–2007) by Ryan M. Geiss, G-Force by Andy O’Meara (which has been licensed for use in Apple’s iTunes music player), Advanced Visualization Studio by Nullsoft, and ProjectM by Pete Sperl and Carmelo Piccione.[7]
Whereas some software artists have sought to produce entertaining or entrancing aesthetic experiences, others have approached the challenge of visualizing music to provide analytic insight into the structure of a musical signal. These works exchange the expressive visual languages of painting and abstract cinema for the conventions of legibility found in diagrams and music notation systems. An early example is Stephen Malinowski’s Music Animation Machine (1982–2001), a software artwork which generated scrolling piano roll representations of MIDI sound files as a real-time graphic accompaniment to the music’s playback.[8] The earliest versions of Music Animation Machine represented notes with colored bars whose vertical position corresponded to their pitch. Later variations of Malinowski’s project incorporated additional visual schema for representing the harmonic or dissonant qualities of musical chords, the spans of melodic intervals, and the timbres of different instrument tracks. Malinowski’s system for showing note pitches is an example of a frequency-domain representation, which alongside the (time domain) waveform is the other principal mainstay of sound visualization systems. Frequency-domain representations take many forms, including piano rolls (so called because they resemble the paper scores used in nineteenth-century player pianos), spectrograms, sonograms, graphic equalizer displays, spectral waterfall displays, 3–D surface spectrograms, and (when applied to voice signals) voiceprints.
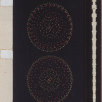
It is very common for audio visualization artworks, whether aesthetic or analytic, to present real-time animated graphics as an accompaniment to sound. Such systems typically display time-based representations of perceptual phenomena like pitch, loudness, and other relatively instantaneous auditory features. An interesting exception to this real-time trend is Martin Wattenberg’s The Shape of Song, a software artwork that produces static images from MIDI music in order to reveal its long-scale and multiscale temporal structures. For The Shape of Song, Wattenberg introduced an entirely new visualization method, termed

Works: Advanced Visualization Studio (AVS), Cthugha, G-Force, Geiss, iTunes , MilkDrop, Music Animation Machine , ProjectM, The Shape of Song
People: Kevin "Zaph" Burfitt, Ryan M. Geiss, Stephen Malinowski, Andy O'Meara, Carmelo Piccione, Pete Sperl, Martin Wattenberg, John Whitney
Socialbodies: Apple Inc., Nullsoft, Inc.